Your best work starts now. Learn how facilities teams can amplify their impact.
Skip To Content
SERVICECHANNEL PLATFORM

Contractor Scorecard

Score every provider on the same data they see – and turn vendor reviews into a continuous improvement loop
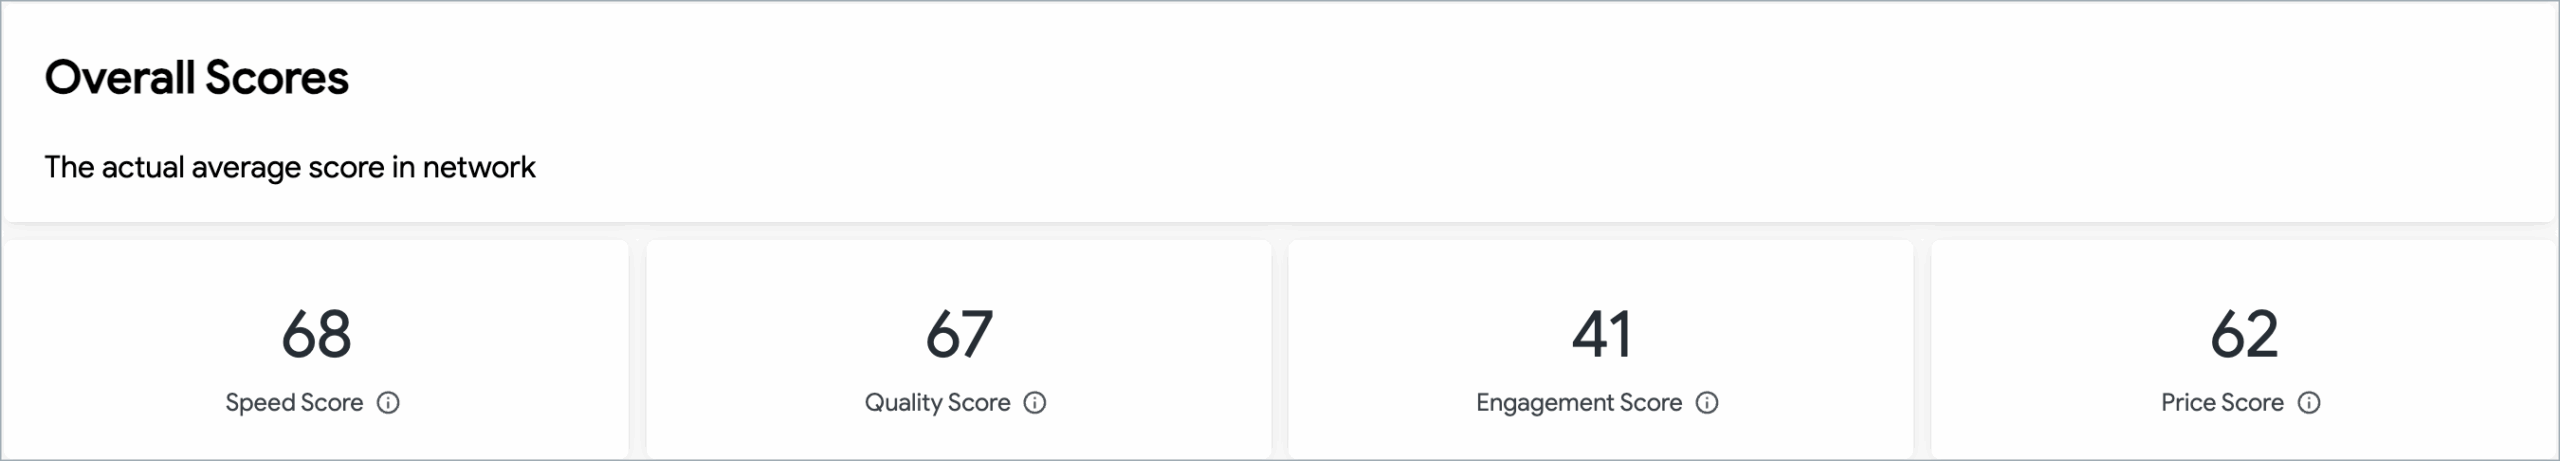
Book a Demo

Improve your provider performance and cost

  • Measure provider performance

    Move provider conversations from anecdote to evidence, with shared visibility into what’s working and what isn’t.

  • Keep an eye on trends

    See provider performance trends across your whole network, by region, by trade, or by individual provider, down to the work order.

  • See how your providers stack up

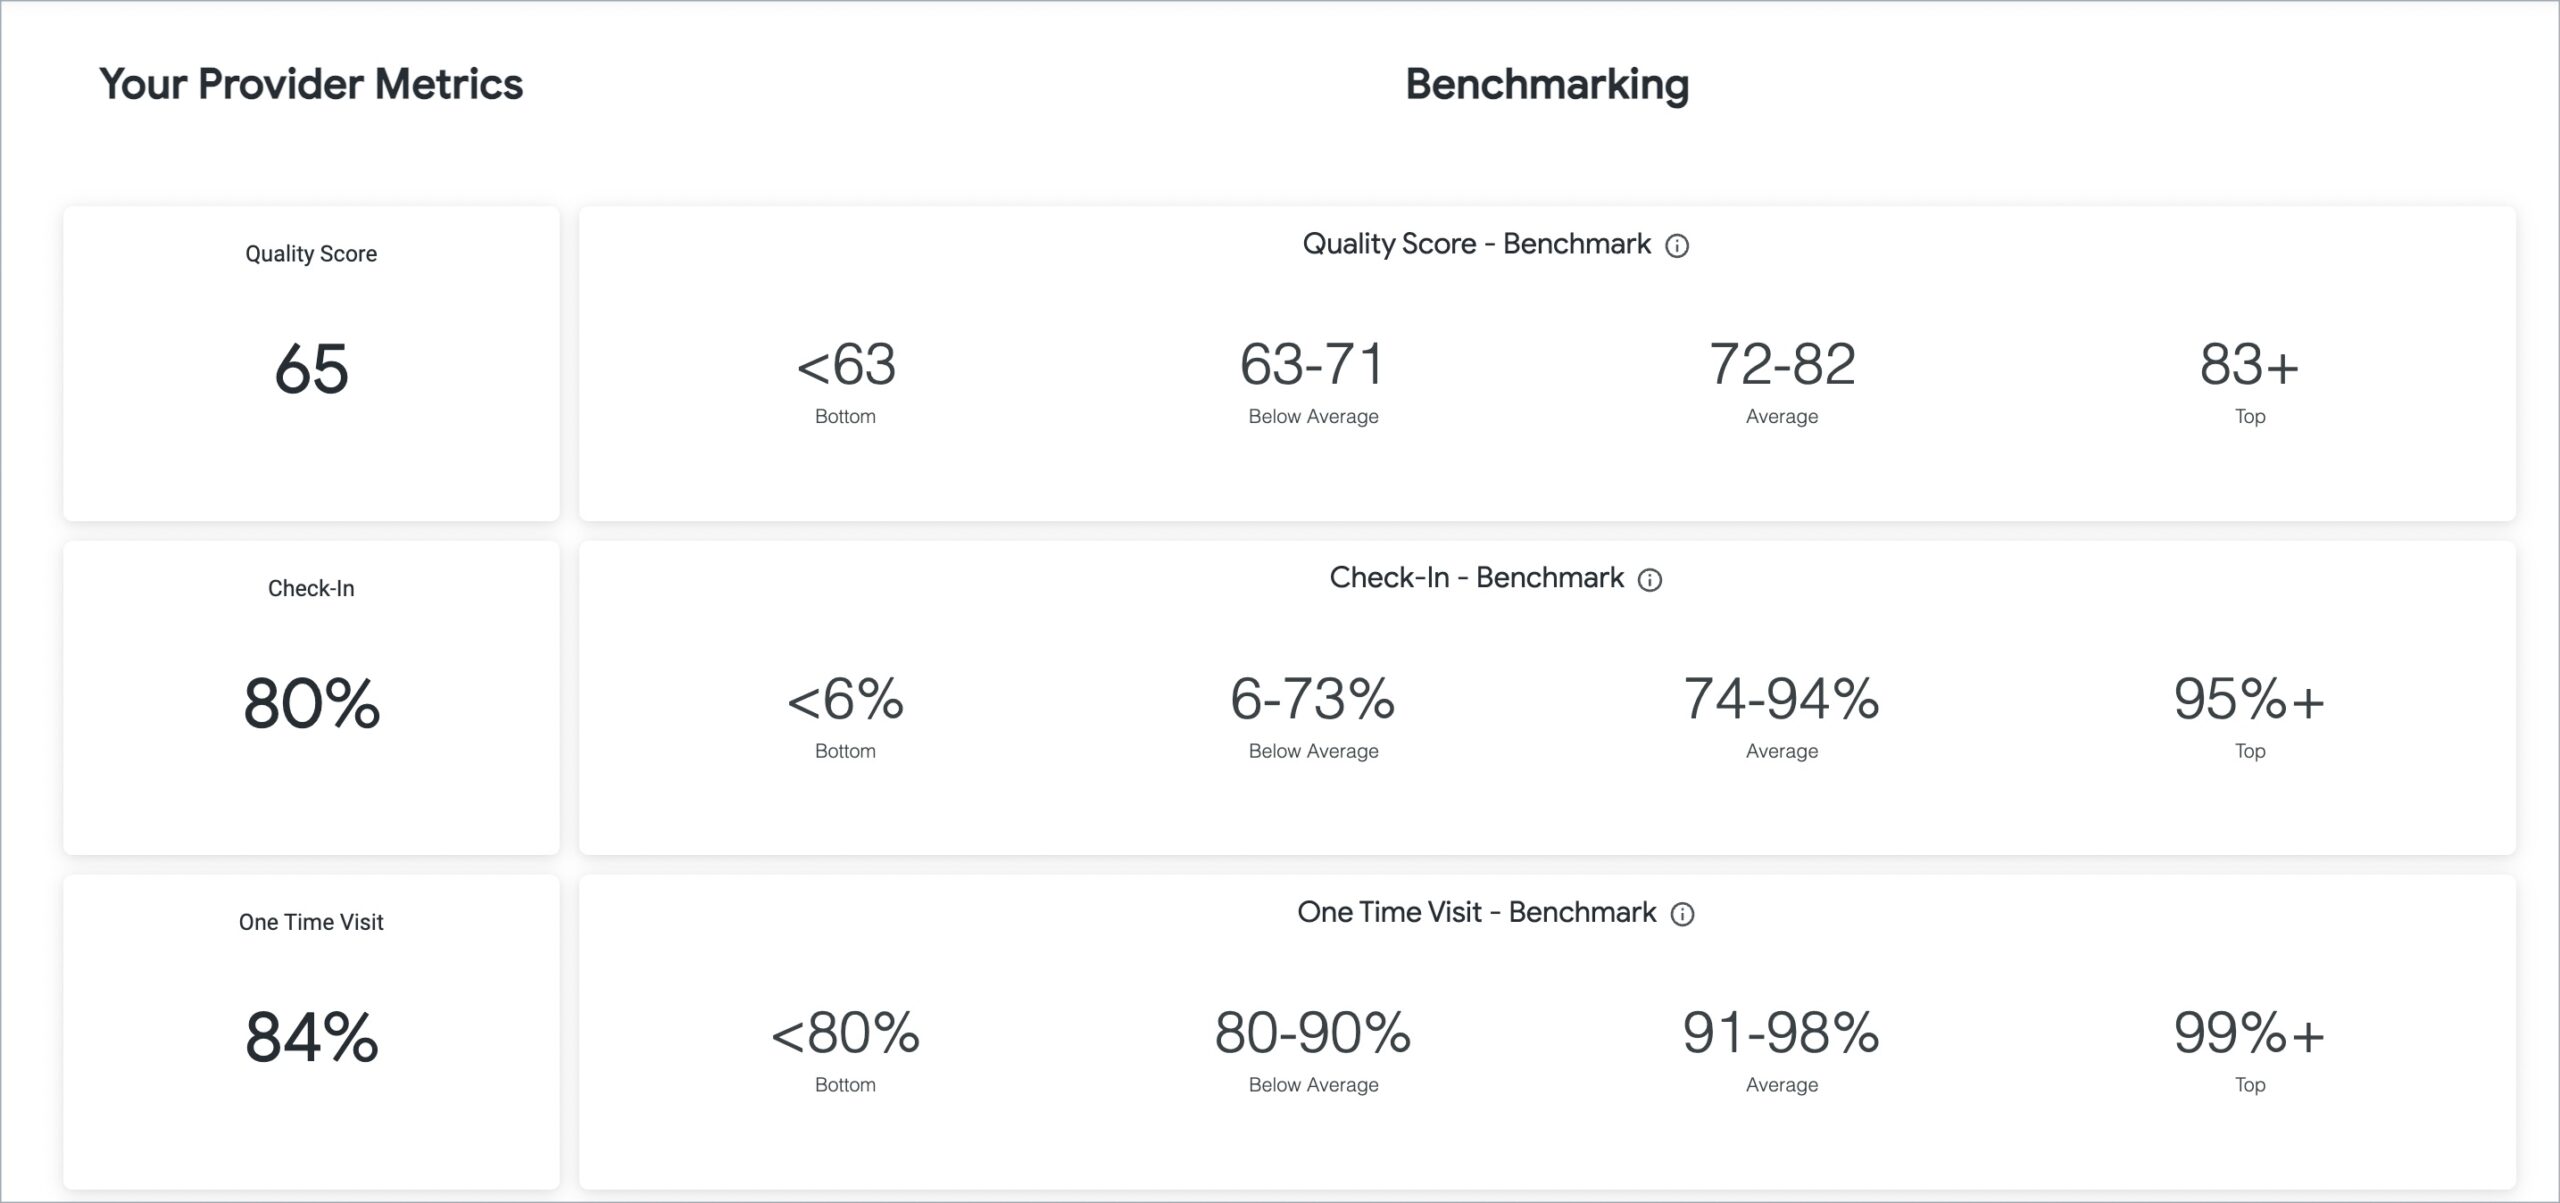
    Benchmark your providers against the top performers across the ServiceChannel network – so you know whether the issue is your provider, your trade, or your market.

Highlights

  • Measure the speed, quality and cost of your providers
  • Monitor metrics for both repair and maintenance work
  • Identify weak spots in your network for improvement
  • Benchmark against thousands of providers and millions of work orders
  • Your provider sees the same metrics as you do
dyne-video
The kind of objective statistics that ServiceChannel provides is worth its weight in gold

Nick Sestito Partner, T&J Electric

Features

Contractor Scorecard makes provider performance measurable, comparable, and actionable, with benchmarking against over 30 million work orders per year across the ServiceChannel Platform. Because providers see the same scores you do, every QBR starts from a shared truth, not a guess, so you can create stronger partnerships and improve service outcomes together.

Network Summary

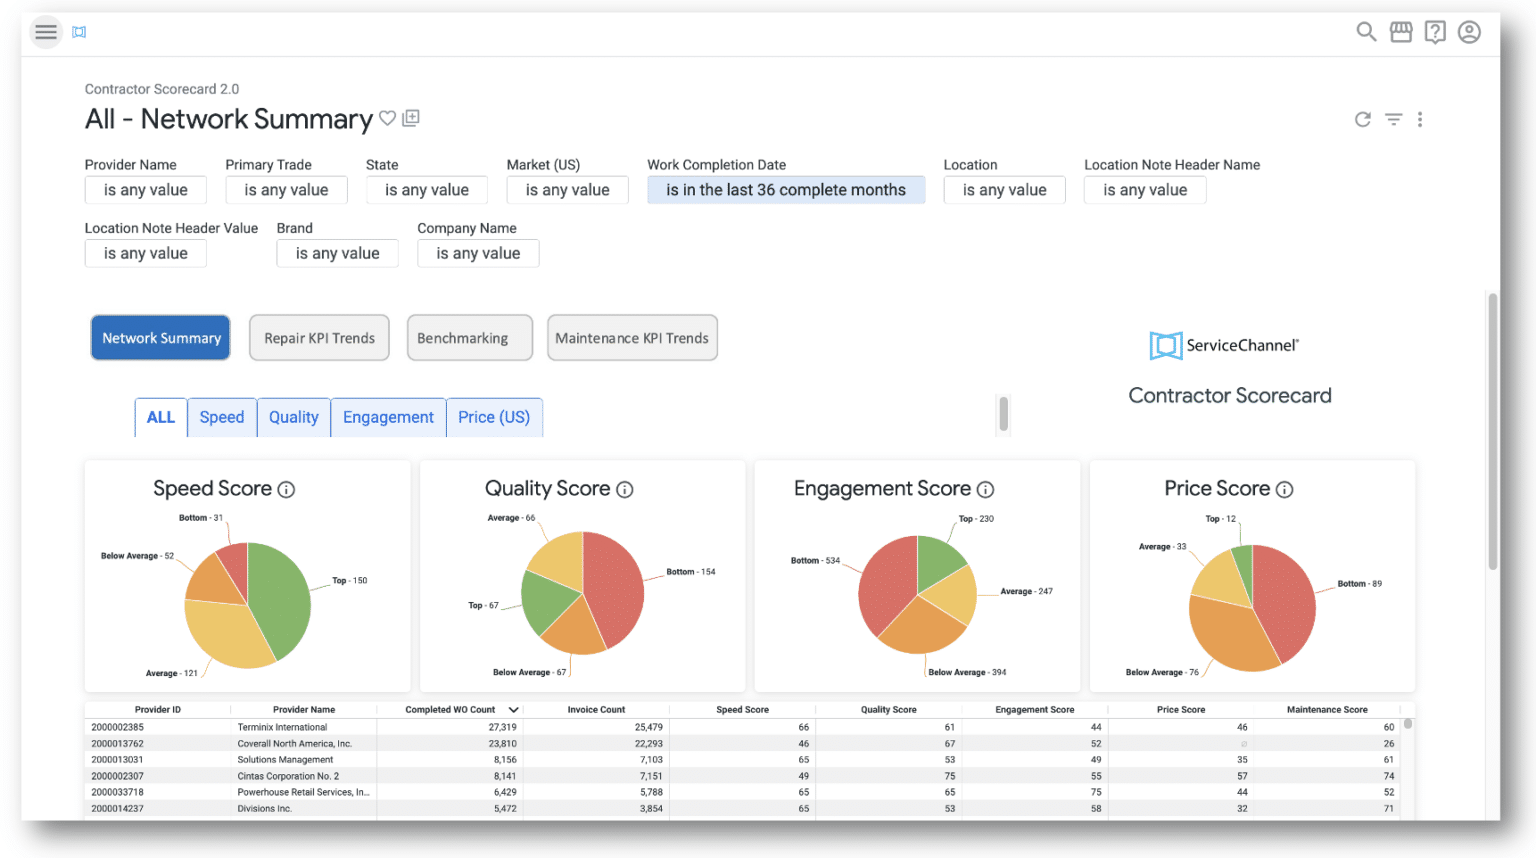
Evaluate the strength of your provider network with data-driven insights

  • Use the Network Summary tab to see how your provider network compares to all the providers on ServiceChannel based on Speed, Quality, Engagement, and Price Scores
  • Dive into each score to see how providers measure on the underlying KPIs

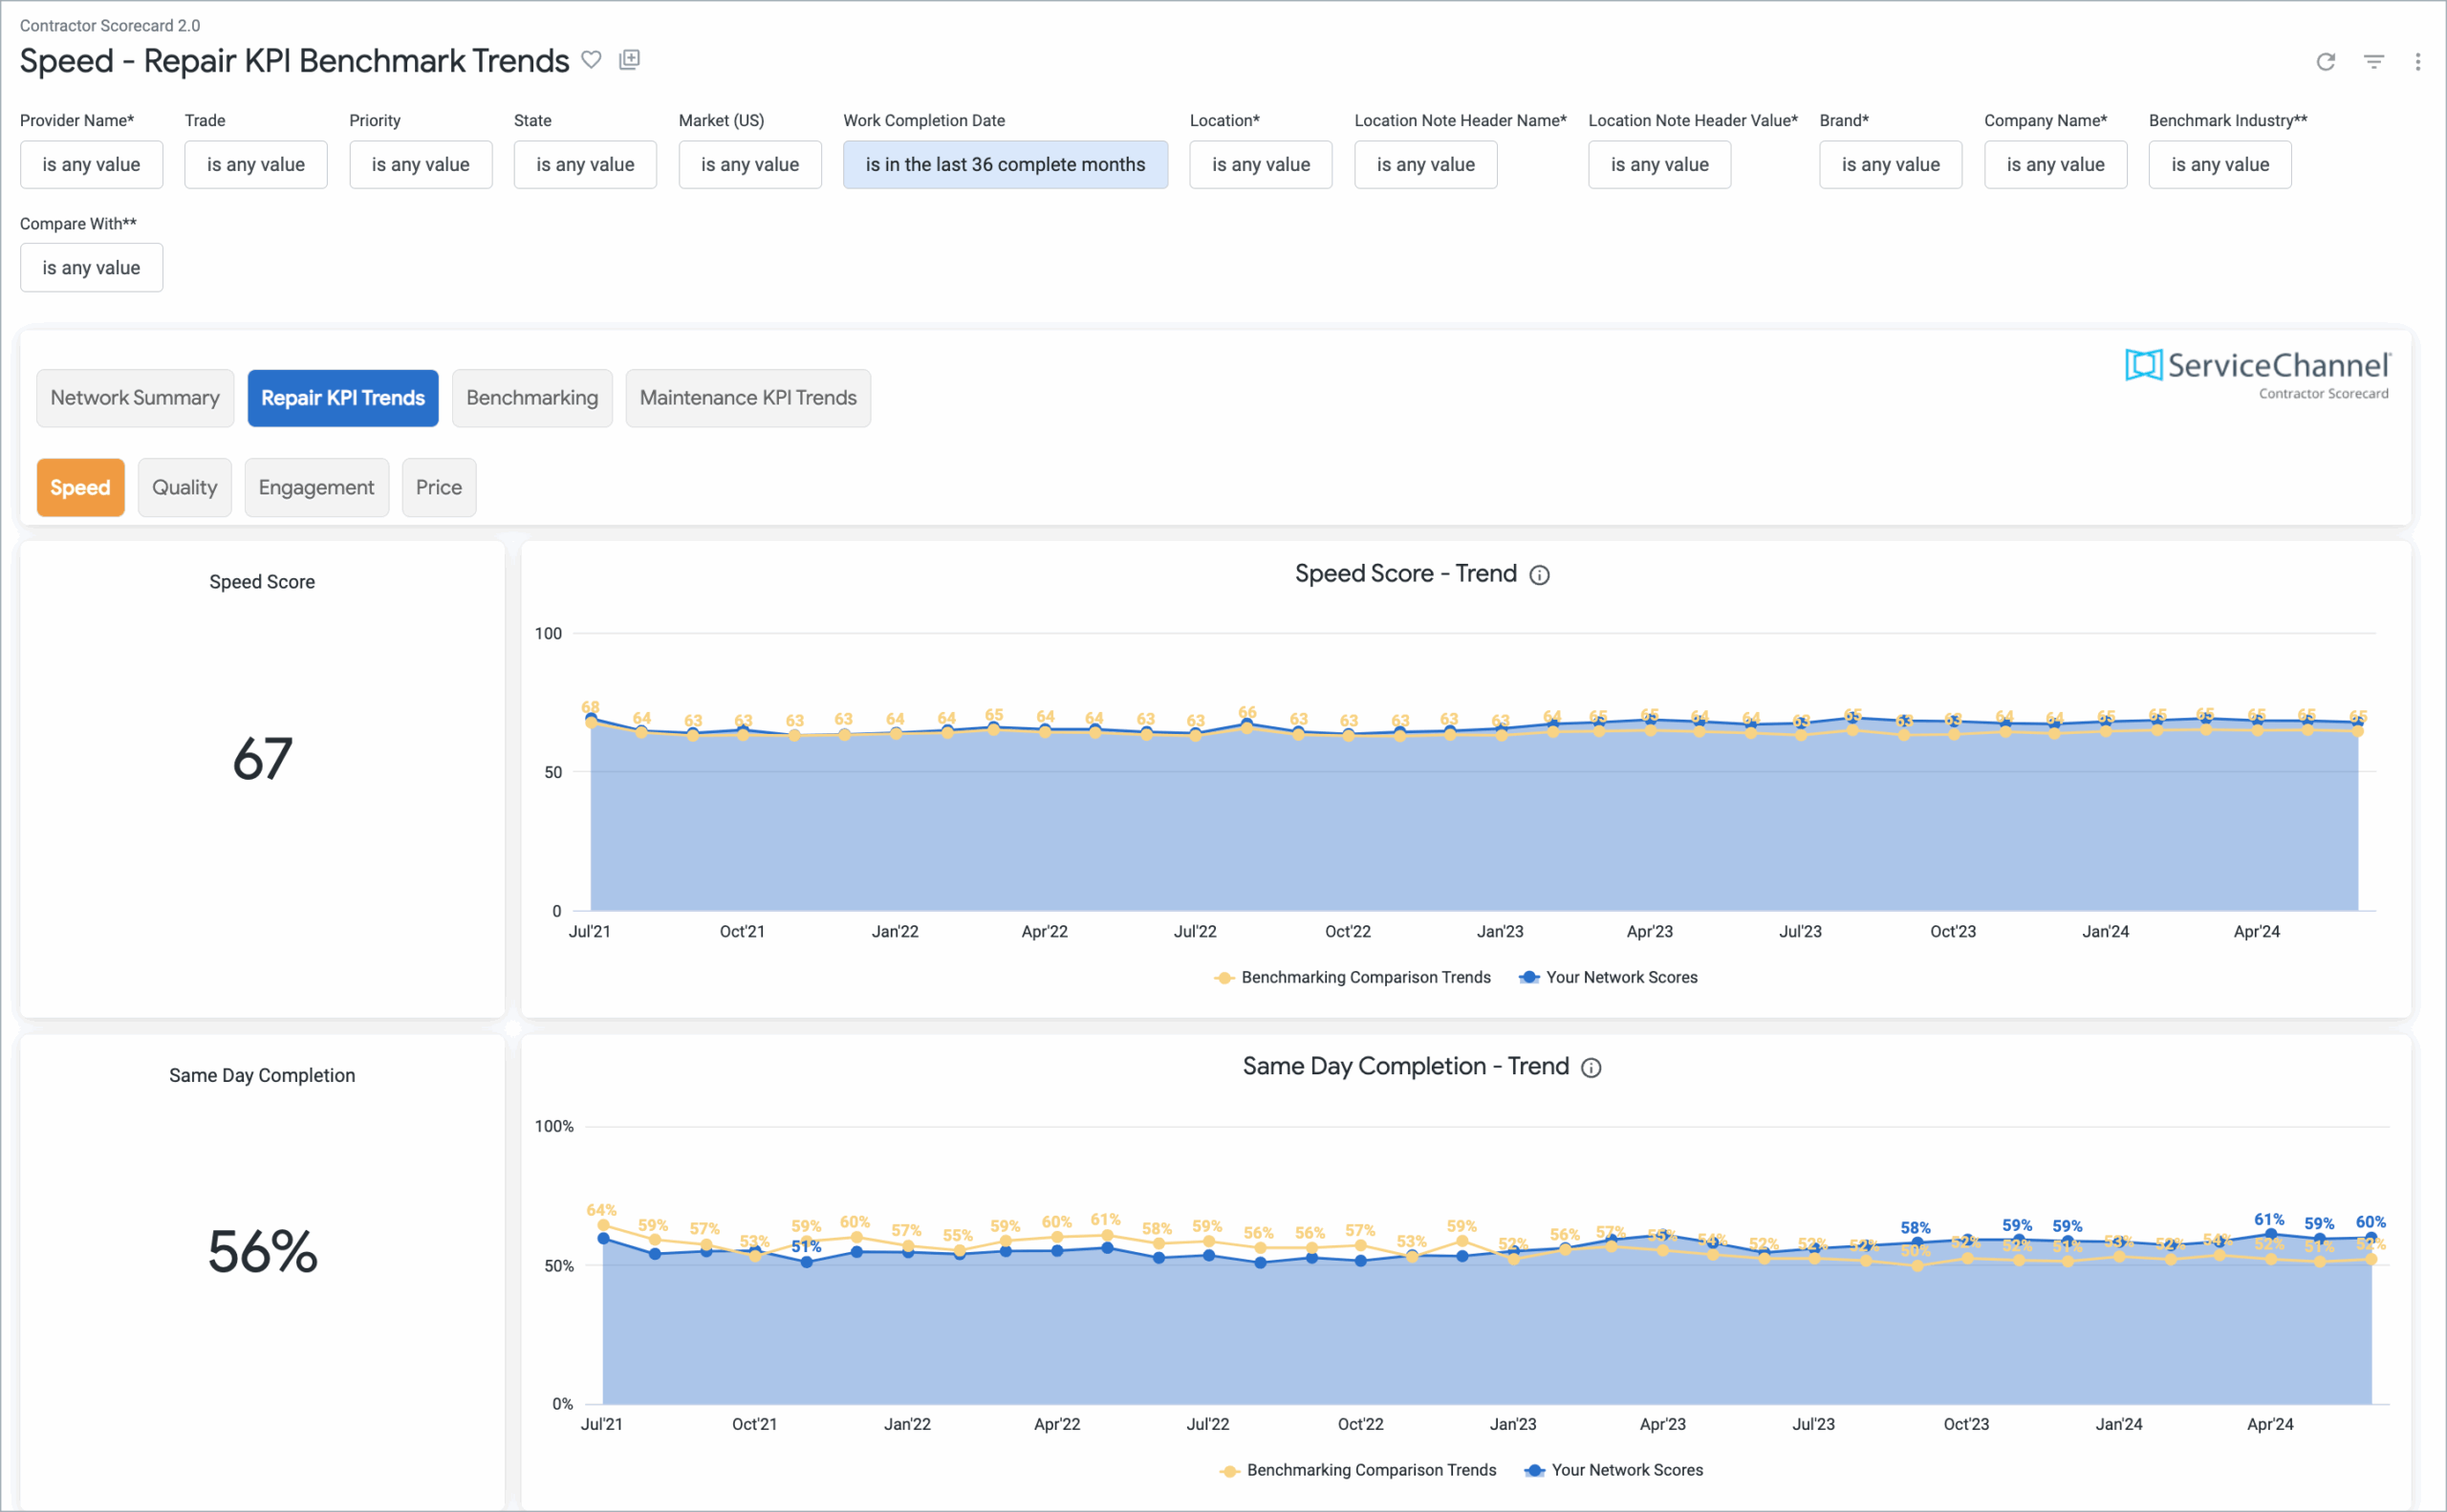
Check on performance trends over time on repair work orders

  • See each score and trendline over time across Speed, Quality, Engagement and Price KPIs
  • You can also see the related work orders by clicking on a single point in time

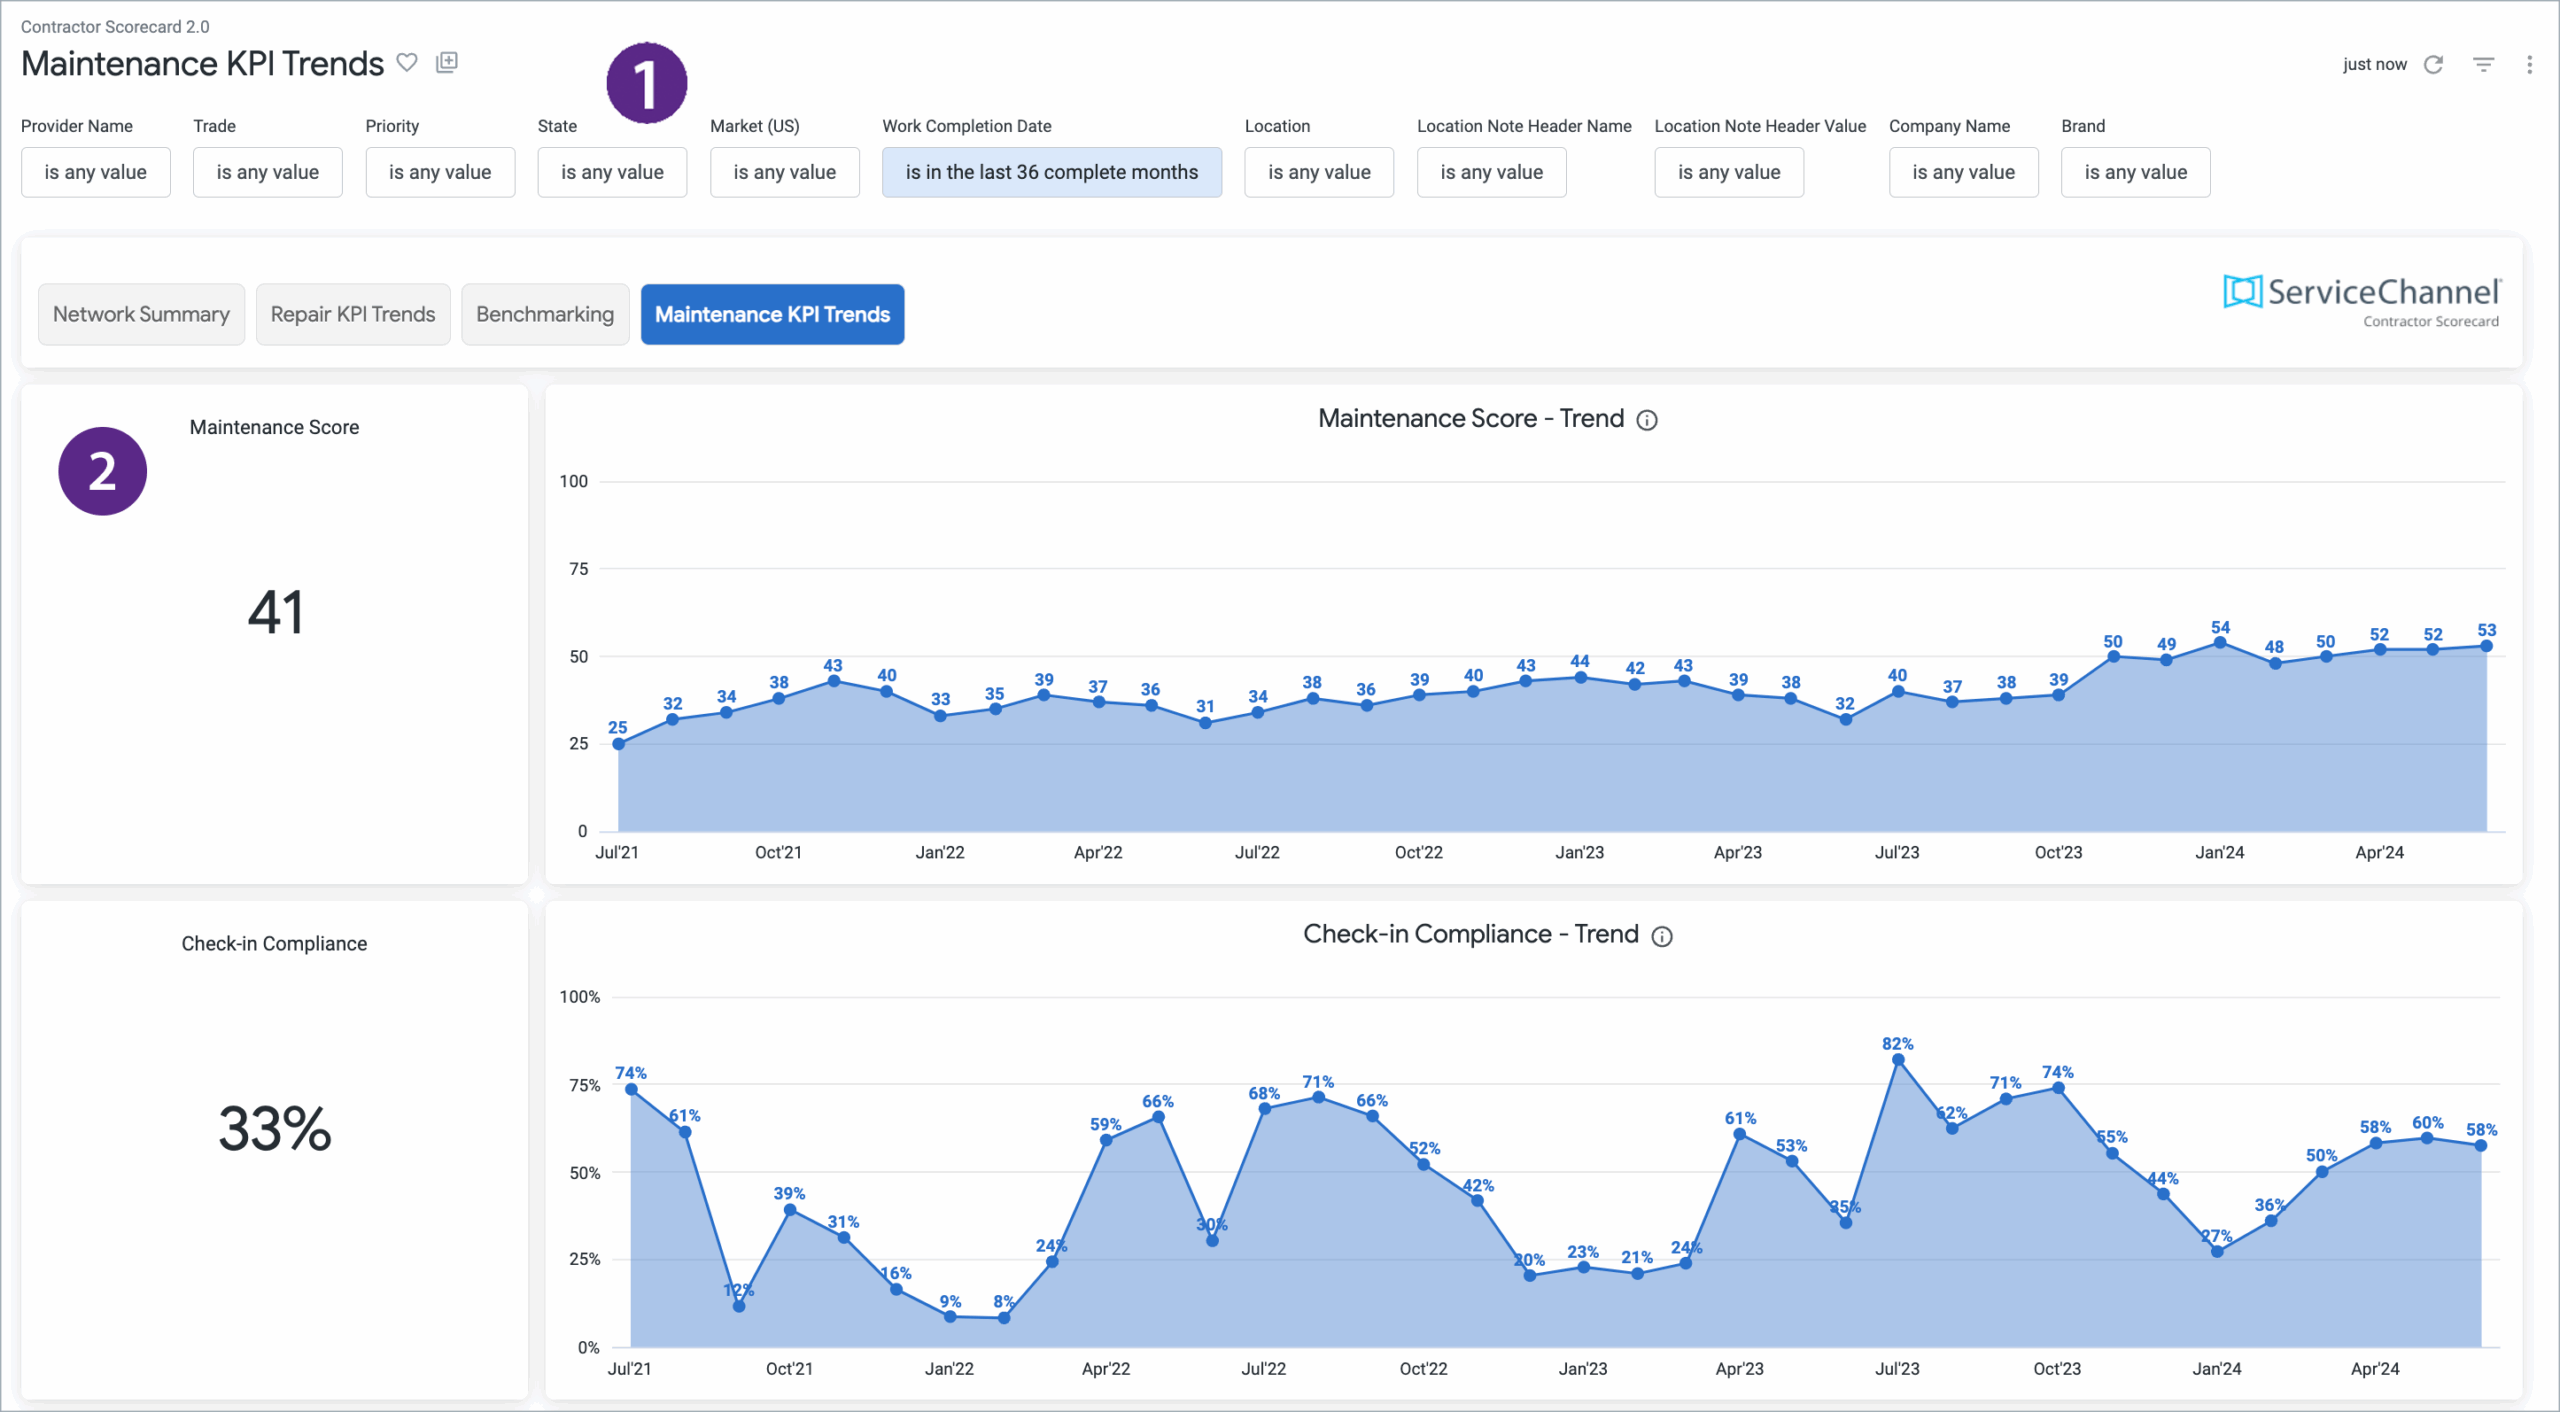
Gauge the efficiency of maintenance efforts with Maintenance KPIs

  • Monitor performance on maintenance work orders, as well as KPI trends over the past year and per location
  • Maintenance KPIs include Check-In Compliance, Schedule Date Entry Confirmation and Scheduled Work Orders Completed

Benchmarking

See how your providers stack up against 70,000+ providers on the ServiceChannel Platform

  • Get a quick snapshot of their performance on ServiceChannel across four tiers: top, average, below average, and bottom
  • Drill into every metric that comprises Speed, Quality, Engagement and Price scores
  • See a list of providers and their scores, with filters for trade, work order priority, location, and date range
  • Quartile distribution view shows where each provider sits within its peer group
  • Compare against peers in your spend size cohort, not just the network average
  • Filter benchmarking by internal vs. external provider for like-for-like comparisons

Network Comparison

Network Comparison lets you compare contractor performance across your entire network—by state, region, trade, and location note

  • Identify performance trends across different geographic and trade segments
  • Pinpoint high-performing regions or trades and areas needing improvement
  • Prepare for business reviews with data-driven insights
  • Catch performance issues before they show up in monthly scores

What your provider sees

Providers can see their speed, quality, engagement and price scores over time

  • They can also see breakdowns by score in the tabs above
  • With this information at their fingertips, they can identify areas for improvement
  • Providers can benchmark against their peers on ServiceChannel by geography and trade

FAQs

Frequently Asked Questions about Contractor Scorecard

Can’t find an answer to your question? Get in touch.

How do the provider scores work?

ServiceChannel evaluates provider performance across four key dimensions of service with Speed, Quality, Price, and Engagement Scores. Each score is calculated from a weighted set of KPI inputs. Scores are computed monthly and benchmarked against every other provider on ServiceChannel performing similar work in similar markets, so the comparison is apples to apples. Remember that a score of 100 would be perfect service, which is impossible in the real world. In reality, a Speed Score of 68 or higher puts a provider in the top 25% of all vendors.

For easy insight, the Benchmarking tab in Contractor Scorecard shows how your providers fall into one of four performance tiers for each score: Top, Average, Below Average, and Bottom. You can select one or more filters for trade, geographic location, industry, and priority to focus your benchmarking on just the providers matching those criteria.

What is the benefit of working with providers with good performance scores?

Provider scores are the best way to spot opportunities to streamline your operations, get better outcomes for your customer and employee experience, and boost your profitability. Good scores reflect great service by the provider and give you the industry’s best way to identify and retain the right new providers to optimize your network.

Can I see benchmarked performance scores for providers that are not in my network?

Only scores for your current providers are shown in Contractor Scorecard, including benchmarking. To benchmark new providers, use Provider Search to compare their overall scores, KPIs, and rankings for your specific criteria.

SEE ALSO

Provider Search

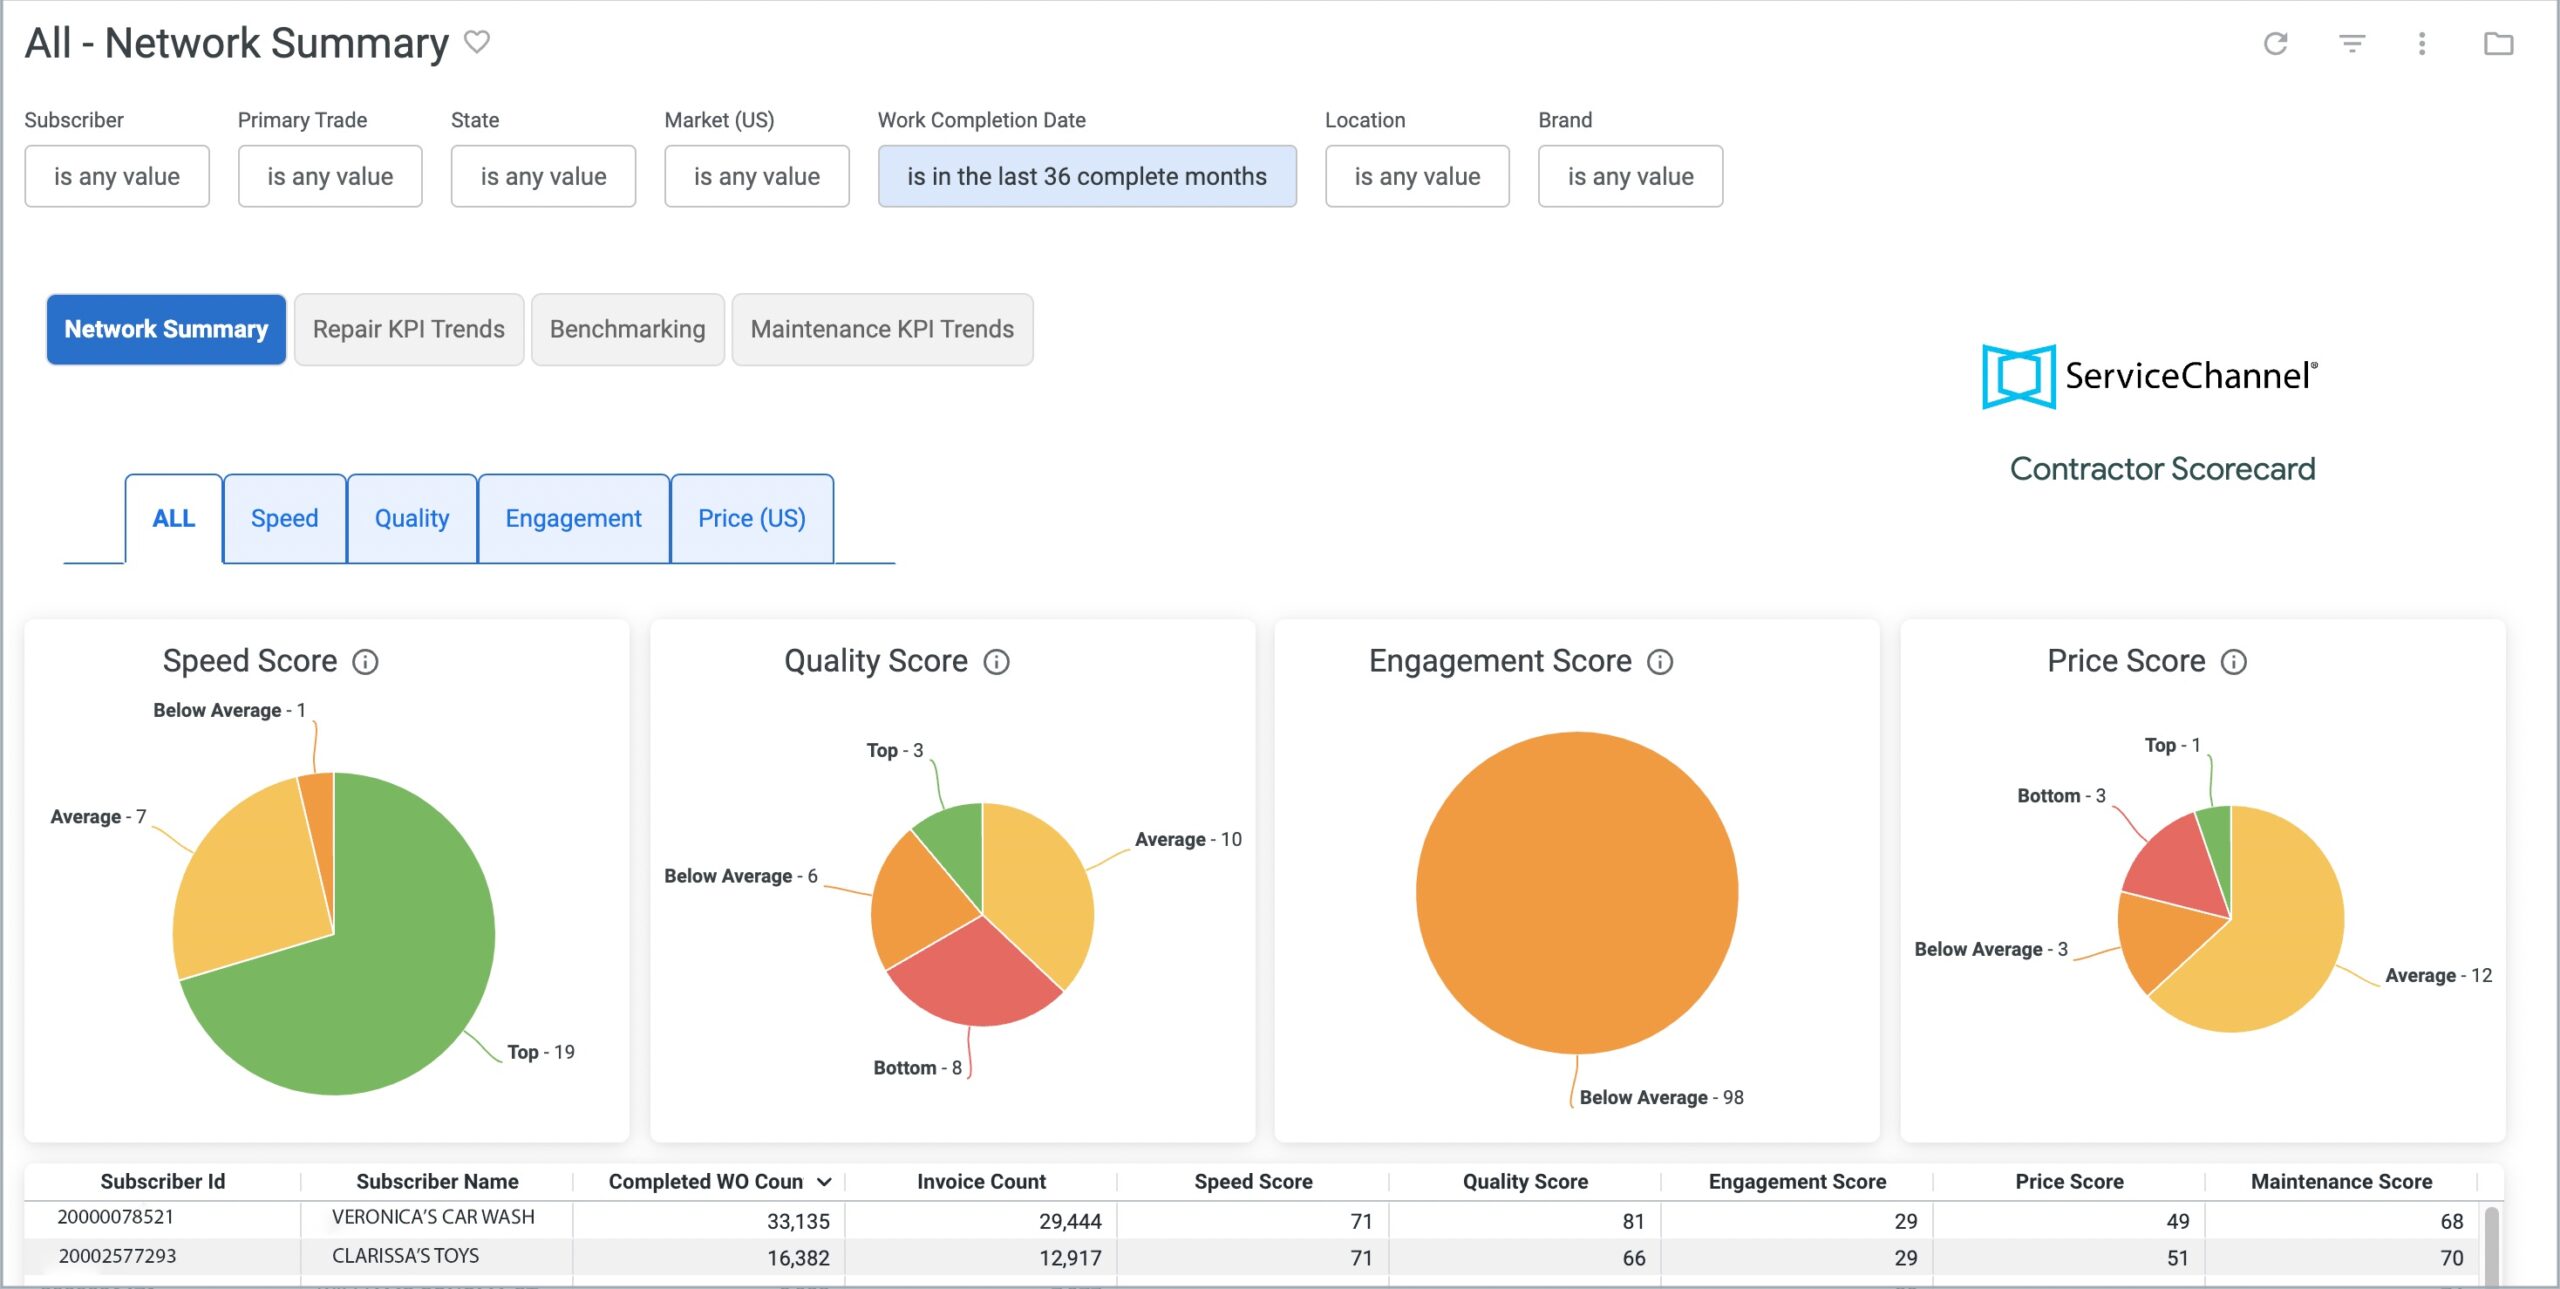
Evaluate providers across quality, speed, engagement, and cost with objective performance data available only on ServiceChannel.

Learn More

Let’s get started

Ready to make every business review more productive?

Tell us about your challenges with provider performance and costs, and we’ll help you build a strategy to achieve your goals.

Book a Demo